












One home. Three months of real-world data. From late summer into autumn, one German household's energy balance reveals how changing seasons influence the performance of home energy storage.
Over three months, Tobias's four solar modules generated approximately 501 kWh of electricity, helping him avoid an estimated €140 in grid electricity purchasing costs.
But the most interesting part of his experience goes beyond the numbers. As summer gradually turned into autumn, both solar production and household energy demands changed. By documenting these shifts, Tobias gained a clearer picture of how home energy storage performs in everyday conditions and how intelligent energy management can help make the most of the energy available.

A Home Setup Built Around Everyday Energy Needs
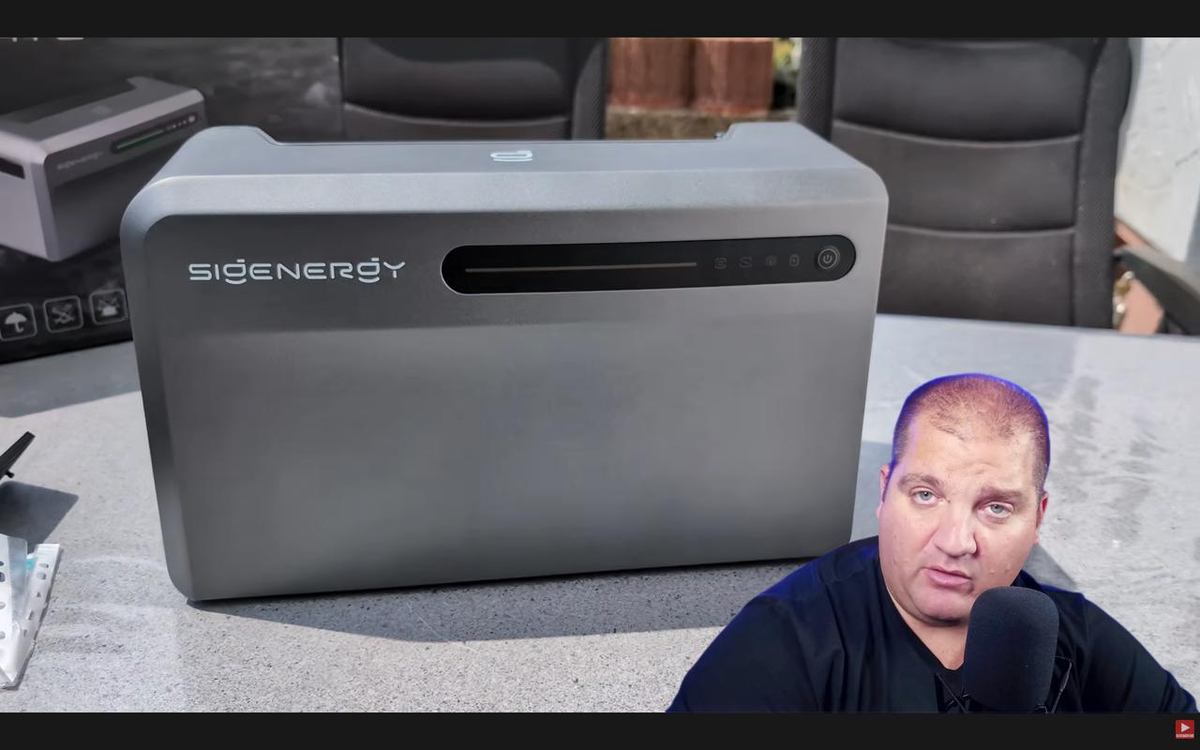
For Tobias, solar energy is more than just a way to generate electricity — it's something he genuinely enjoys exploring. Living in Friedrichsthal, he has developed a strong interest in home solar technology, both as a solar enthusiast and through his YouTube channel, Technikzentrale 24. Having already gained hands-on experience with systems from other brands, he knows that every setup offers something different. These experiences have given him a practical perspective on what really matters when solar technology becomes part of everyday life.
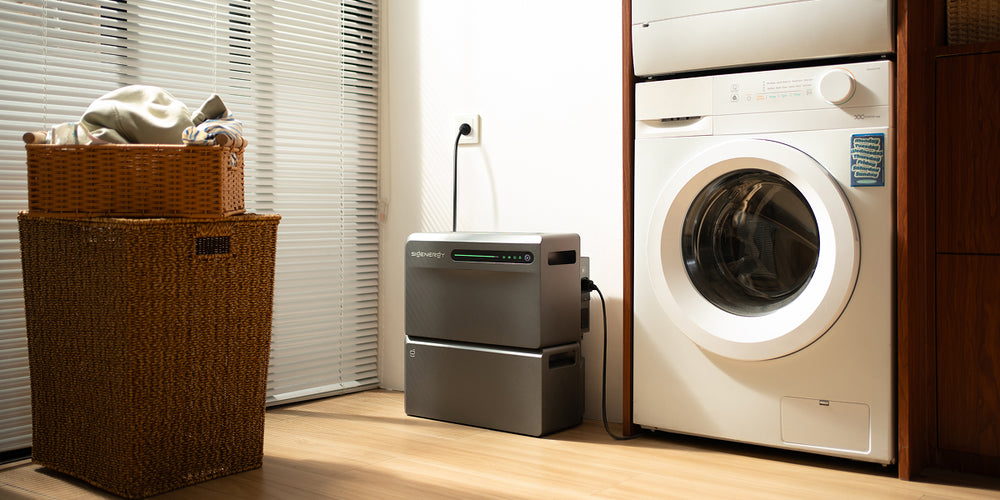
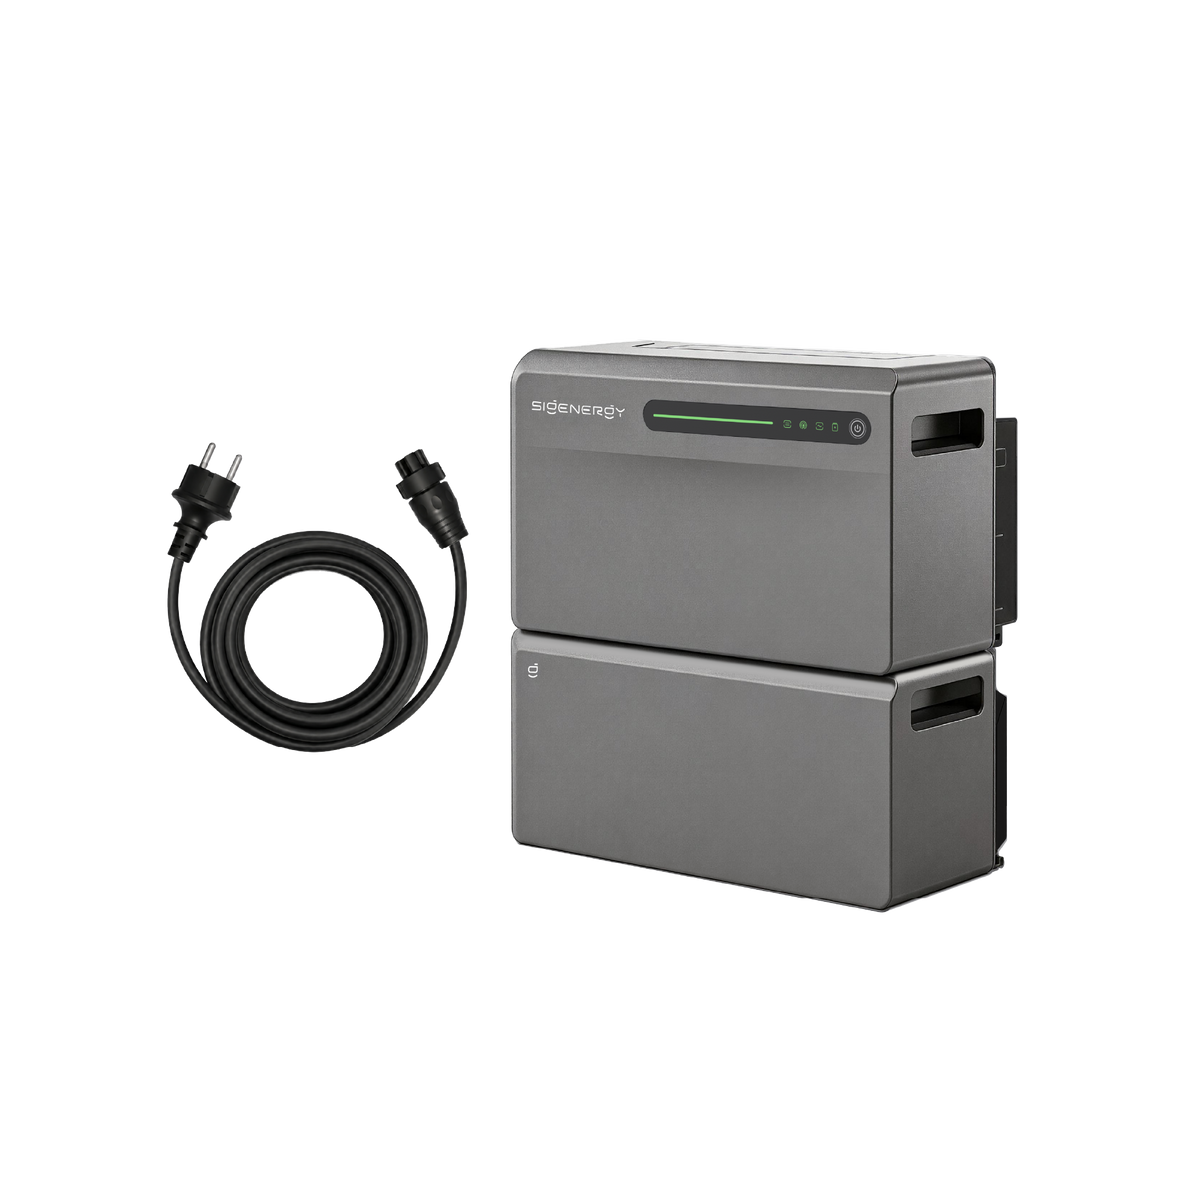
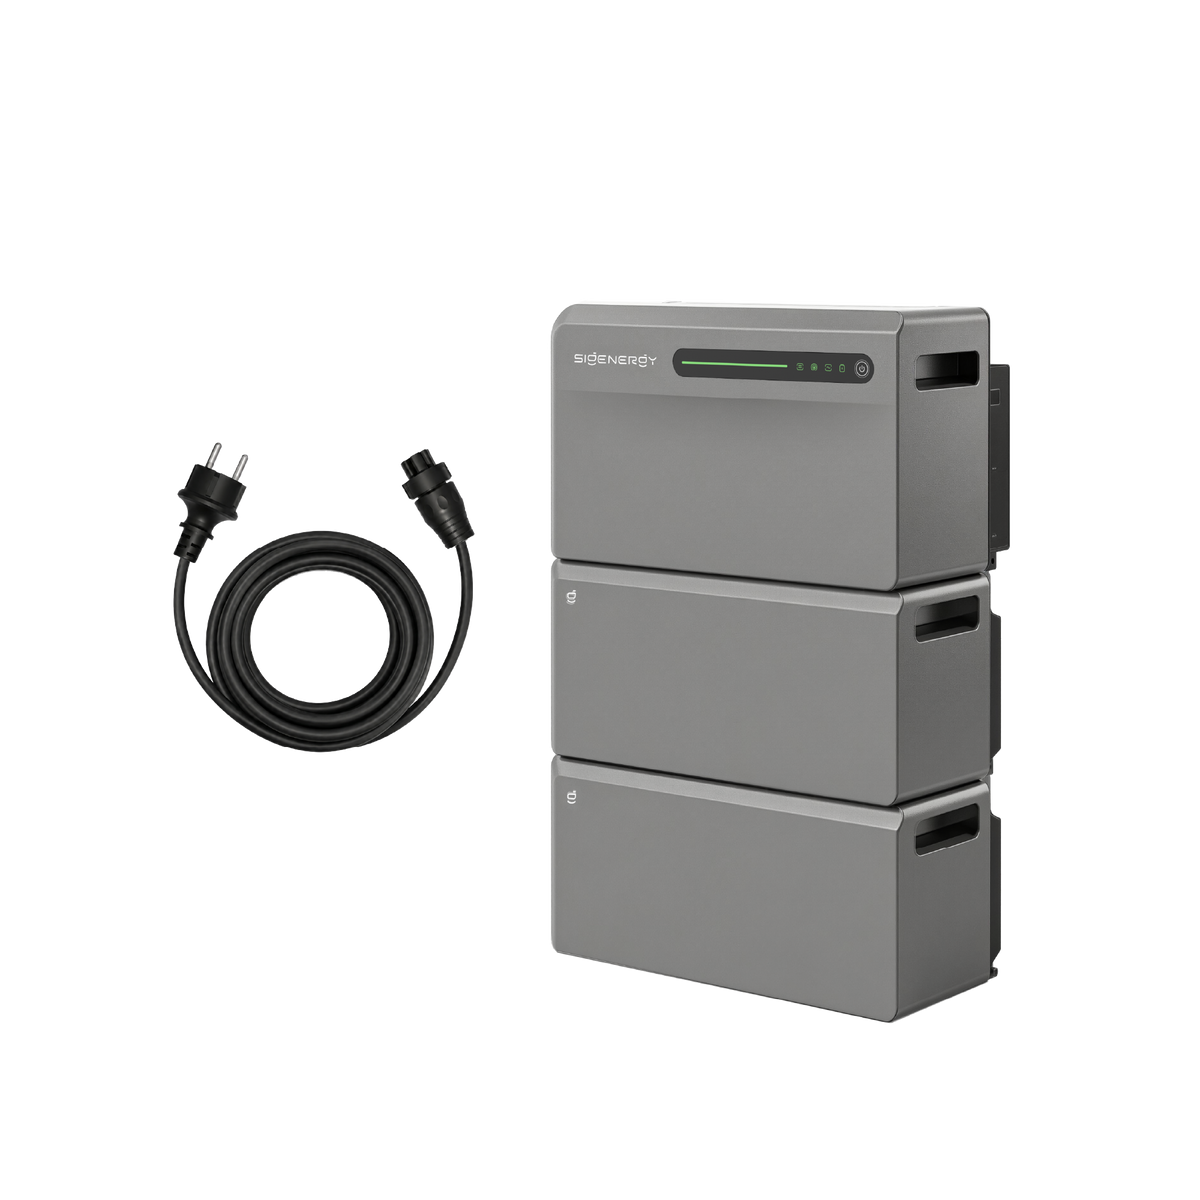
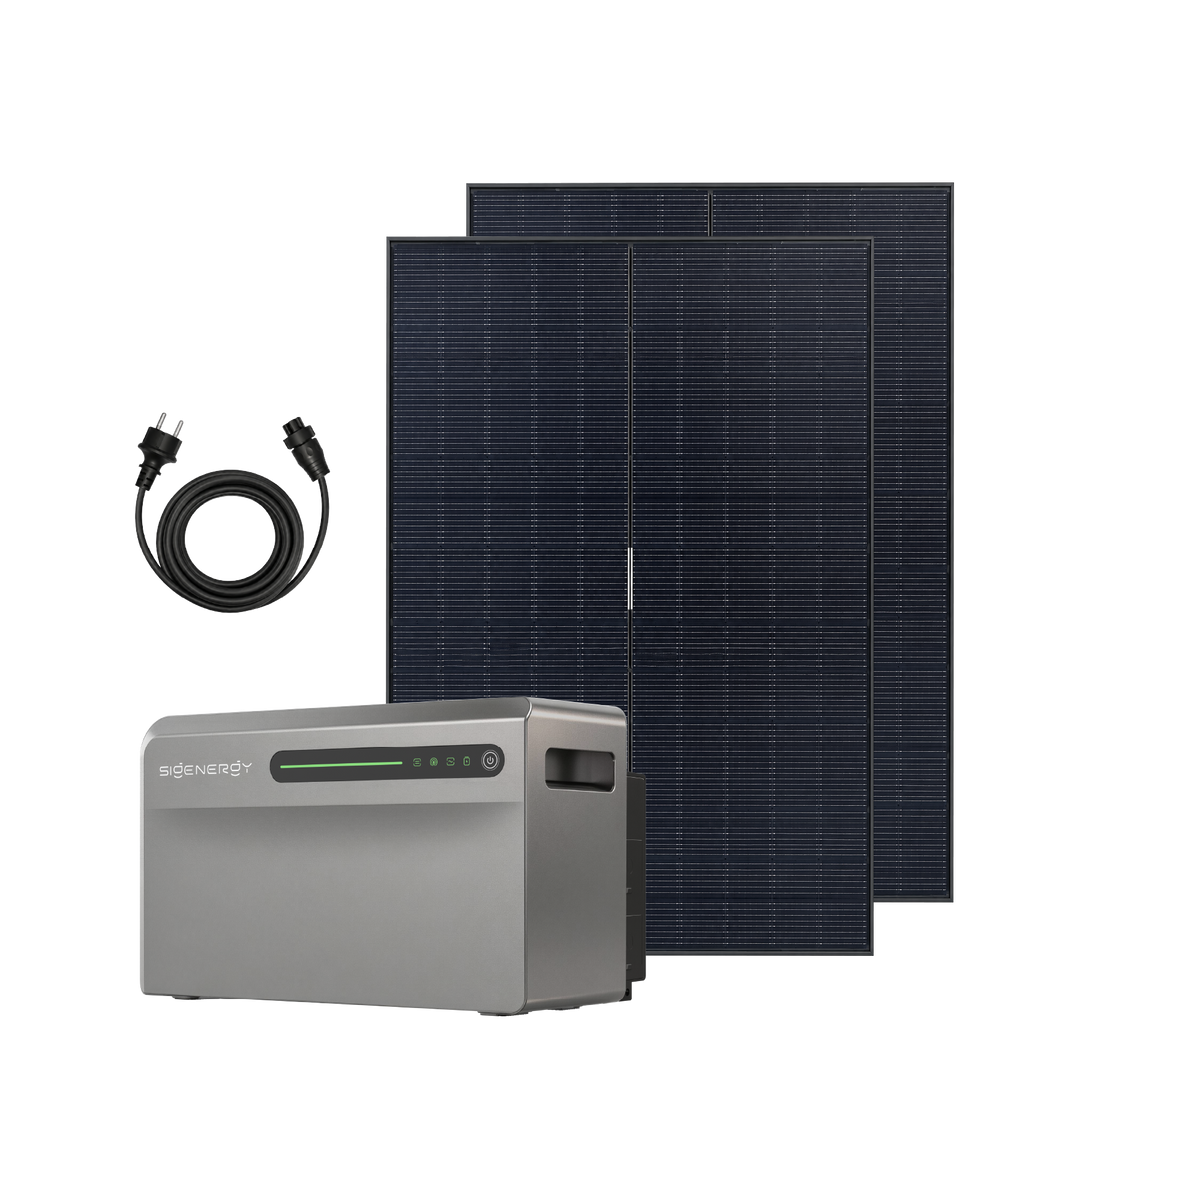
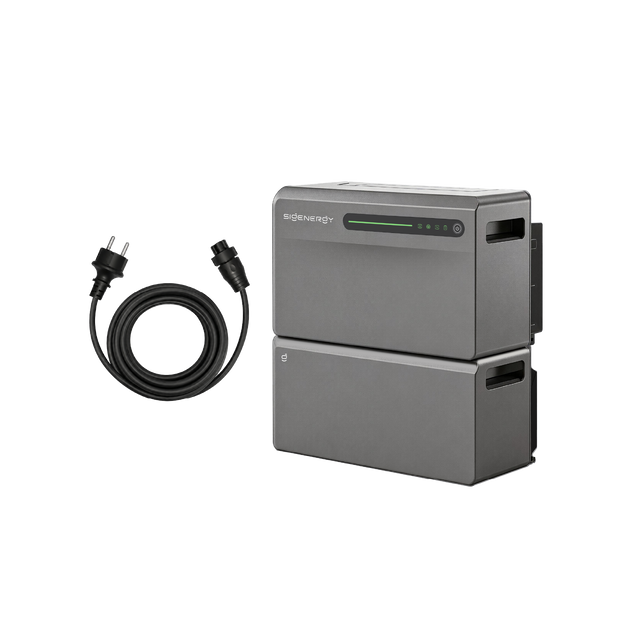
Now, he was ready to explore another solution in his own home: the SigenMate 2700 Ultra.
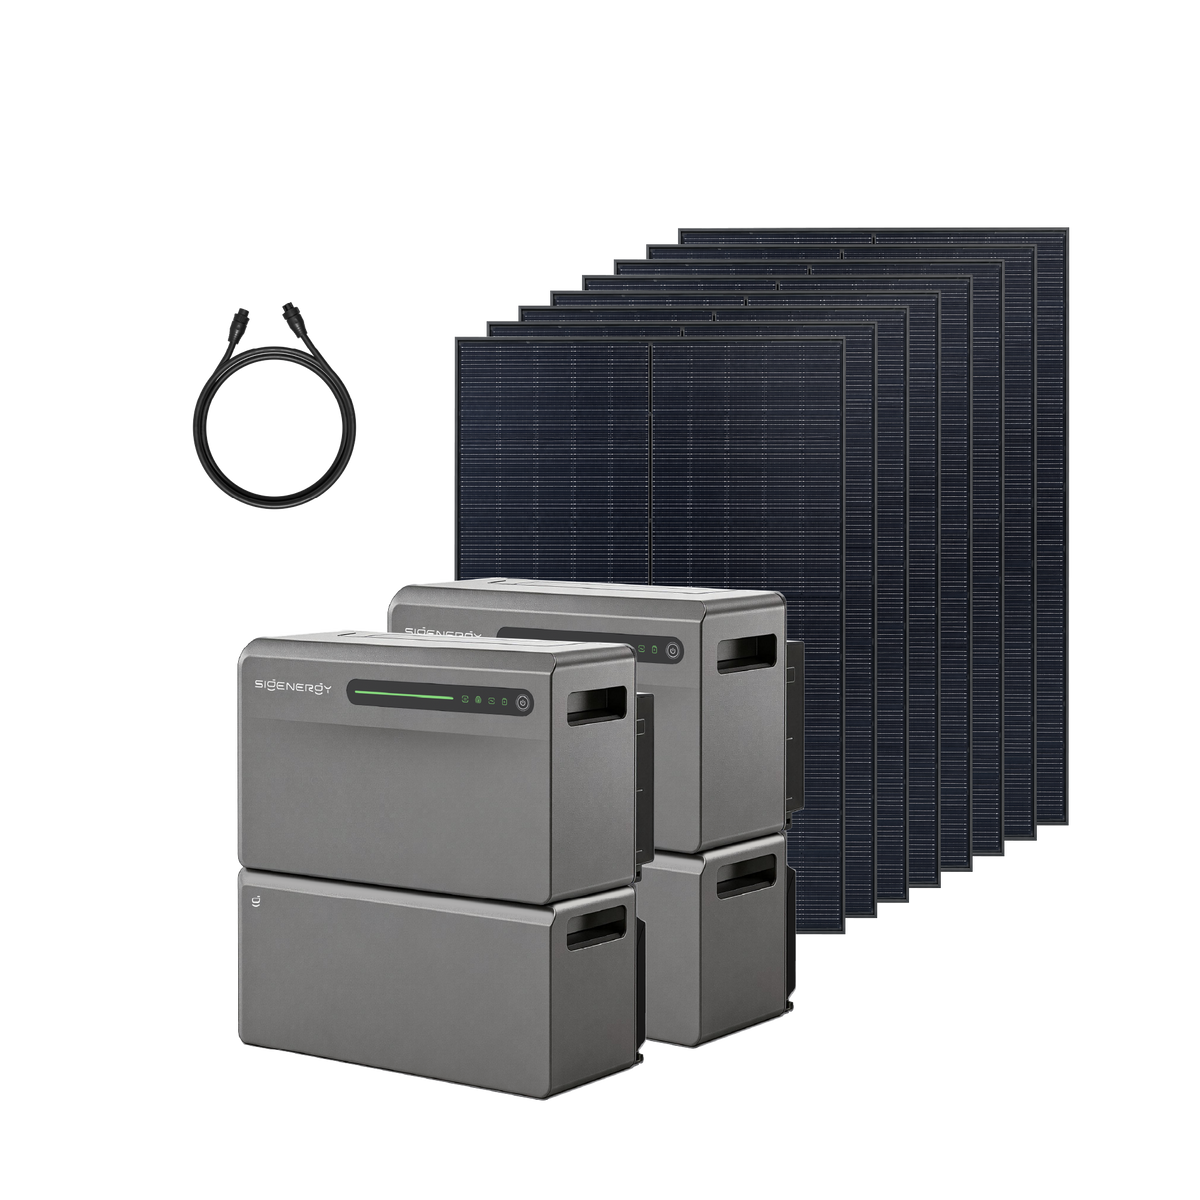
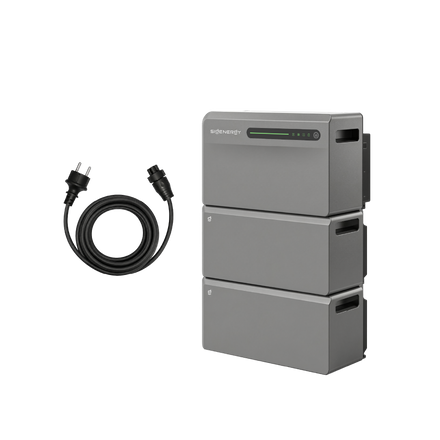
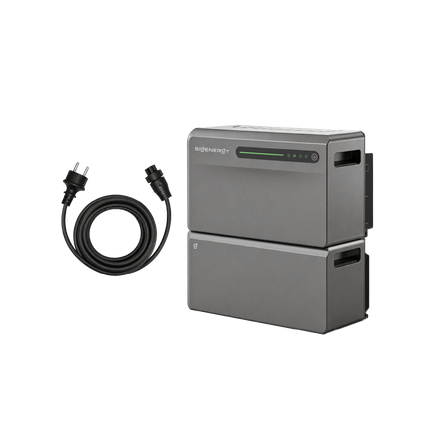
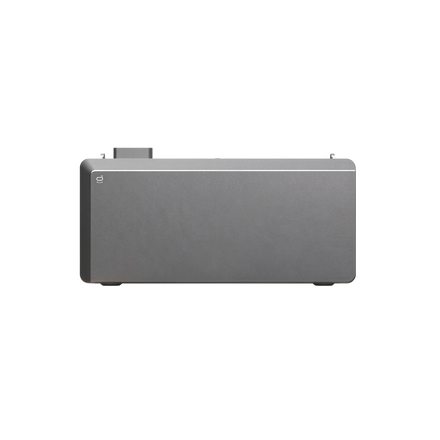
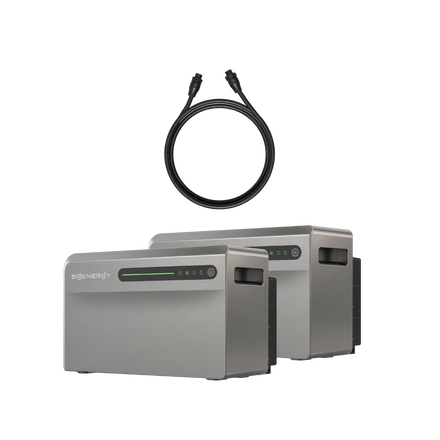
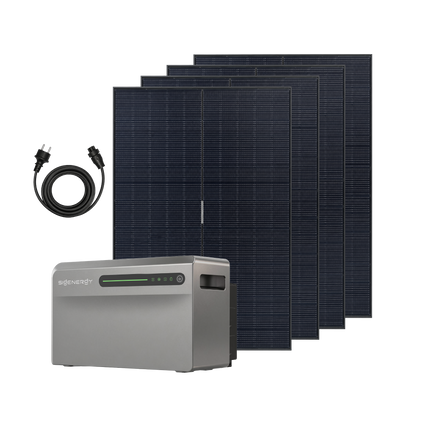
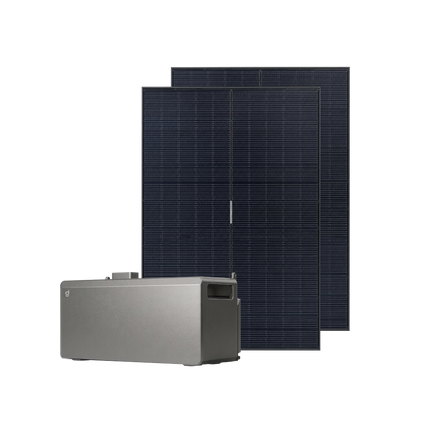
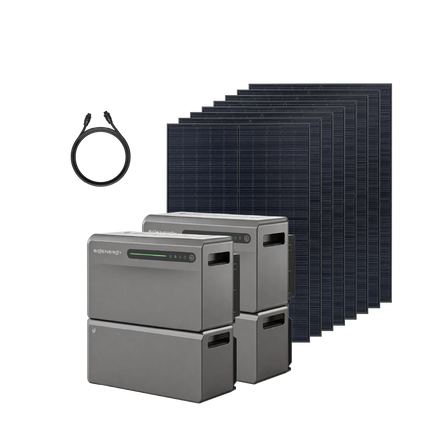
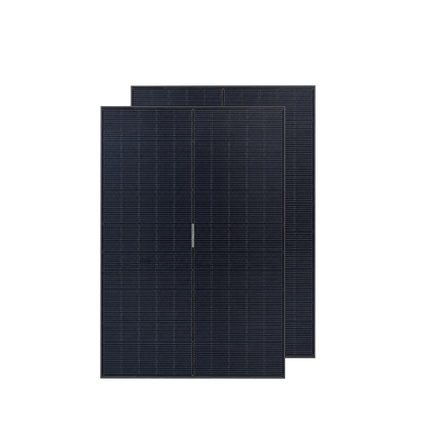
His setup brings together four solar modules with a combined capacity of 1.78 kWp and a SigenMate 2700 Ultra paired with an additional battery module, providing a total storage capacity of 5.4 kWh. Starting on August 1, 2026, Tobias began monitoring the system's performance and observing how it worked alongside his household's everyday energy consumption.
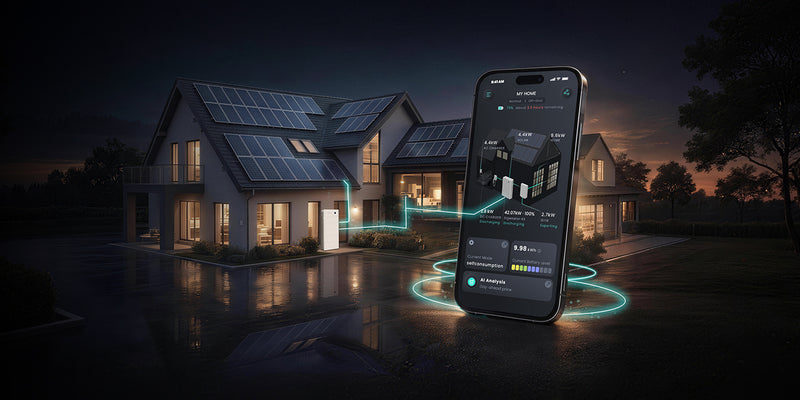
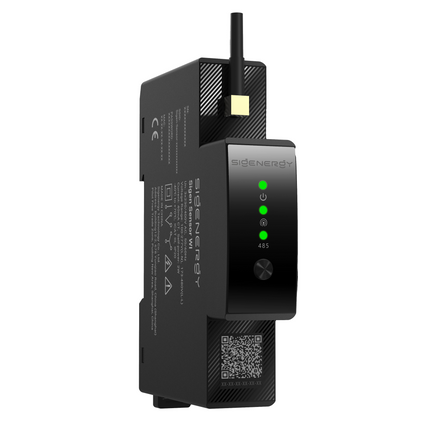
He monitored its performance through the MySigen App and comparing selected measurements with an independent EcoTracker connected to his household electricity meter.
Rather than focusing on a single performance metric, he followed several indicators throughout the test:
- Solar energy generated by the PV modules.
- Total household electricity consumption.
- The share of household demand covered by solar energy.
- Battery charging, discharging and estimated efficiency.
- Electricity imported from and exported to the grid.
- The resulting reduction in electricity purchasing costs.
This approach offers a more complete picture of how a residential energy storage system performs beyond the conditions of a short product demonstration.

August: Putting Solar Energy to Work
The first month established a promising baseline.
In August, Tobias's 1.78 kWp solar installation generated 201.1 kWh of electricity, while his household consumed 361.8 kWh.
An impressive 98.3% of the solar energy generated was used within the household or stored for later use, resulting in an energy self-sufficiency rate of 51.2%.
In practical terms, more than half of his household's electricity demand was covered without having to purchase that energy from the grid.
The battery played an important role. During the month, it received 96.3 kWh of charge and delivered 83.2 kWh back to the household. Based on these figures, Tobias calculated an estimated battery round-trip efficiency of 86.4%, equivalent to approximately 17.8 full charge cycles.
The financial impact was equally tangible. Based on an electricity price of €0.30 per kWh, the reduced need to purchase electricity from the grid represented an estimated €55.95 in avoided costs for August.
For a household with more than 360 kWh of monthly electricity consumption and a relatively modest solar installation, the results demonstrated how effectively solar generation and battery storage could work together.
September: More than just energy production
September brought slightly different conditions.
Solar generation declined to 194.9 kWh, while household consumption fell to 335.9 kWh, partly because Tobias was away on holiday.
Despite producing less electricity, the system achieved a higher energy self-sufficiency rate of 53.3%. The battery covered 25.4% of total household consumption, and its estimated round-trip efficiency increased to 87.0%.
The battery charged 98.2 kWh and discharged 85.4 kWh, completing approximately 18.2 full cycles.
The estimated reduction in grid electricity costs was €53.56.
However, September's most interesting development was not simply another set of performance figures. Tobias also wanted to establish whether the energy data displayed in the MySigen App could be trusted.
To find out, he compared the app's readings with those independently recorded by an EcoTracker connected directly to his electricity meter.
The results were close:
- Grid electricity imported according to the MySigen App: 156.7 kWh.
- Grid electricity measured by EcoTracker: 158.37 kWh.
- Difference: approximately 1%.
The comparison of exported electricity was similarly consistent, with 2.85 kWh reported by the app and 2.925 kWh measured by EcoTracker.
For Tobias, this was an important result. The figures gave him confidence that the app could provide a reliable basis for tracking and evaluating his household's monthly energy performance.
September also marked the introduction of zero-feed-in functionality through the MySigen App 4.1.2 update. When the battery is full, SigenMate can automatically reduce solar input to limit unwanted export to the public grid.
Although the feature was only available for a few days at the end of September, it became another important part of his ongoing testing.
October: When the seasons change the equation
October presented a very different picture.
Solar generation fell to just 105 kWh, a 46% decrease compared with September. At the same time, household electricity consumption increased to 422 kWh, 86 kWh more than the previous month.
The reasons were largely seasonal.
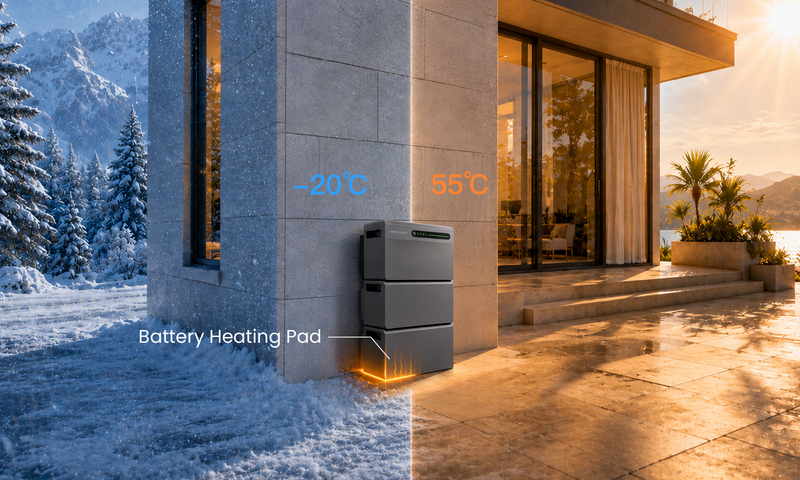
With the sun lower in the sky and daylight hours becoming shorter, the four solar modules simply had fewer opportunities to generate electricity. Tobias had installed them at a 50-degree angle to make better use of the lower autumn sun, but even a steeper installation could not compensate for the reduced sunlight.
Household demand also changed. As the temperature of the incoming cold water dropped, the electric instantaneous water heater in the bathroom needed more energy per litre.
Longer evenings increased lighting consumption, while the heating circulation pump and a basement dehumidifier added to the household's overall demand.
The combined effect was clear.
Energy self-sufficiency fell to 24%, while the battery covered just 9% of total household consumption. It completed approximately eight full charge cycles during the month.
The estimated reduction in electricity purchasing costs also declined to around €30.
Yet these results do not necessarily point to a problem with the storage system. They illustrate a fundamental characteristic of solar energy: a battery can only store the surplus electricity that the solar modules produce after the household's immediate demand has been met.
When generation falls and consumption rises simultaneously, less energy is available to store.
For Tobias, October provided a practical demonstration of how significantly seasonal conditions can influence the performance of a home energy system.
Three Months, One Changing Energy Picture
Looking at the three months together provides a more complete view of Tobias's experience.
From August to October, his four solar modules generated approximately 501 kWh of electricity. Based on his monthly calculations and an assumed electricity price of €0.30 per kWh, the system helped him avoid around €140 in grid electricity purchasing costs.
These figures represent estimated avoided electricity purchases from the combined solar-and-storage system, not battery-only savings or income from feeding electricity into the grid. This is one German household’s experience; results in the Netherlands depend on the installation, weather, consumption and electricity contract. Similarly, the battery discharge-to-charge ratios are estimates derived from monthly operating data, not laboratory measurements of round-trip efficiency.
More importantly, the three months revealed how differently a home energy system can perform under changing conditions. The strongest results came when solar generation and household consumption were relatively well aligned. As autumn progressed, shorter days and higher energy demand changed that balance.
For Tobias, this is precisely why following the system over several months matters more than looking at a single impressive result.
| Performance indicator | August | September | October |
|---|---|---|---|
| Solar generation | 201.1 kWh | 194.9 kWh | 105 kWh |
| Household consumption | 361.8 kWh | 335.9 kWh | 422 kWh |
| Energy self-sufficiency | 51.2% | 53.3% | 24% |
| Battery share of household consumption | 23% | 25.4% | 9% |
| Discharged-to-charged energy ratio | 86.4% | 87.0% | — |
| Full battery cycles | 17.8 | 18.2 | ~8 |
| Estimated avoided electricity costs | €55.95 | €53.56 | ~€30 |
Energy Management Is a Year-Round Journey
Three months have not given Tobias one fixed answer about home energy storage. Instead, they have given him something more useful: a clearer understanding of how his household produces, consumes and manages electricity as conditions change.
August showed what solar generation and battery storage could achieve under favorable conditions. September gave him an opportunity to examine the data more closely and explore additional energy management features. October revealed the challenges that come with shorter days, reduced solar production and higher household consumption.
As testing continues into winter, one thing is already clear: the limiting factor is no longer storage capacity, but generation. With fewer hours of usable sunlight, the battery rarely reaches full charge, and every kilowatt-hour the modules produce counts.
For Tobias, this is the real value of the last three months: not a single headline figure, but a transparent, measured picture of what a balcony storage system can and cannot do across the seasons. The winter months will show how much of the household's demand a system of this size can still cover when conditions are at their least favourable.
Another advantage for technically minded users: SigenMate offers a local Modbus TCP interface, so it can be integrated into Home Assistant. This allows energy flows to be tracked alongside other household data and surplus power to be put to use. When the battery is full, appliances such as a dehumidifier can be switched on automatically instead of curtailing solar generation.
Testing is still ongoing.


Leave a comment
This site is protected by hCaptcha and the hCaptcha Privacy Policy and Terms of Service apply.